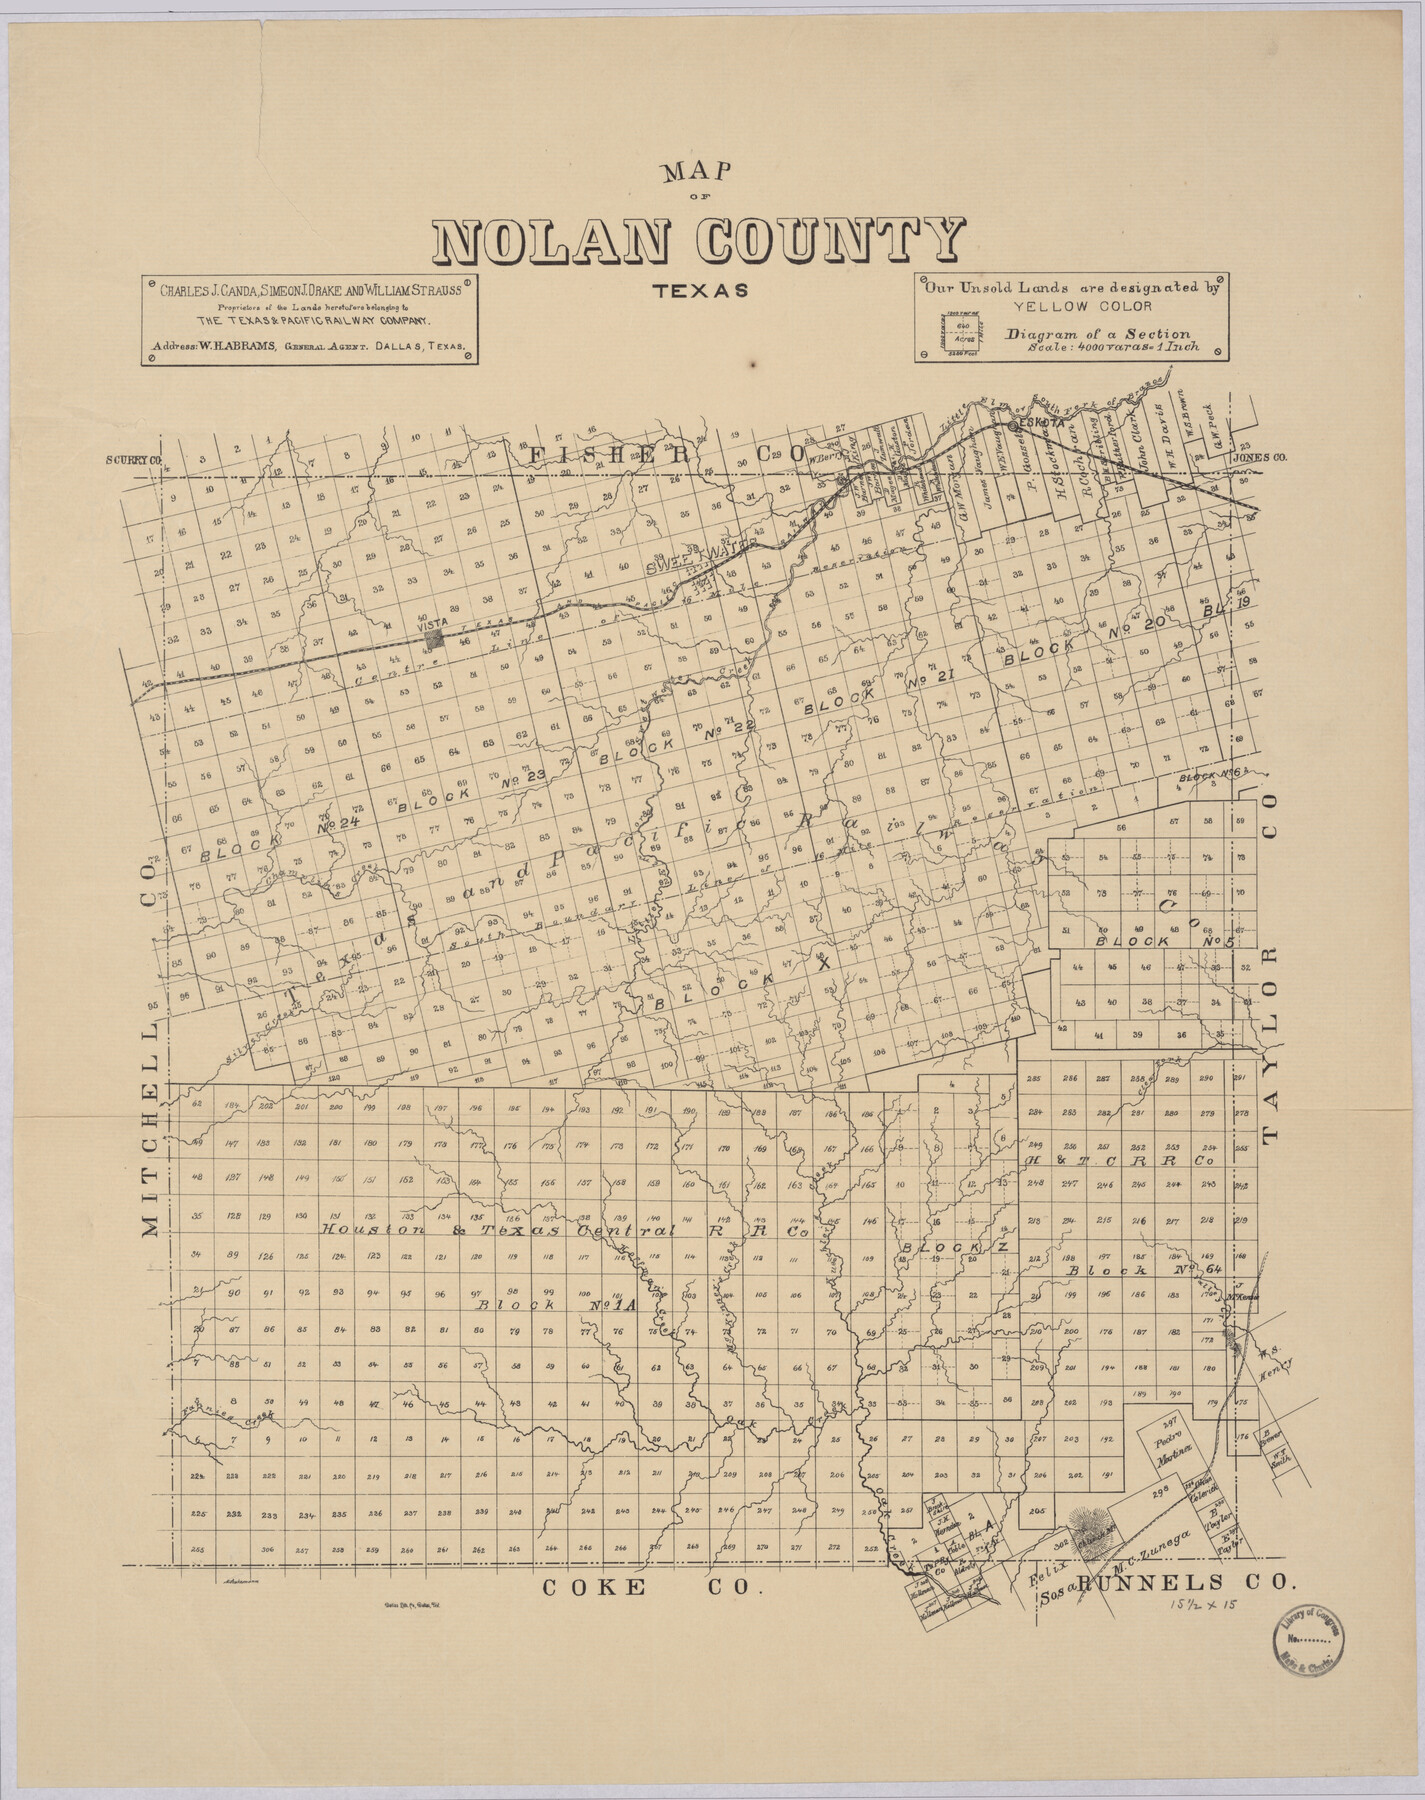
Map of Nolan County, Texas
-
Map/Doc
88984
-
Collection
Library of Congress
-
Object Dates
[1890 ca.] (Creation Date)
-
People and Organizations
C. J. Canda, S. J. Drake, W. Strauss (Publisher)
Dallas Lithograph Company (Printer)
M. Stakemann (Draftsman)
-
Counties
Nolan
-
Subjects
County
-
Height x Width
24.4 x 19.3 inches
62.0 x 49.0 cm
-
Comments
Prints available from the GLO courtesy of Library of Congress, Geography and Map Division.
Part of: Library of Congress
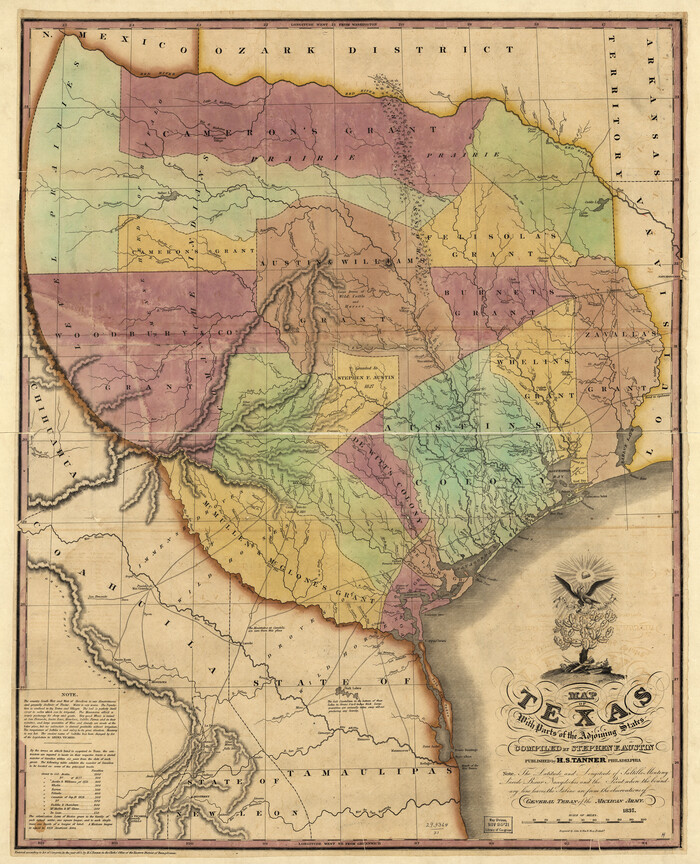
Map of Texas With Parts of the Adjoining States
Print $20.00
Map of Texas With Parts of the Adjoining States
1837
Size 29.9 x 25.2 inches
Map/Doc 88998
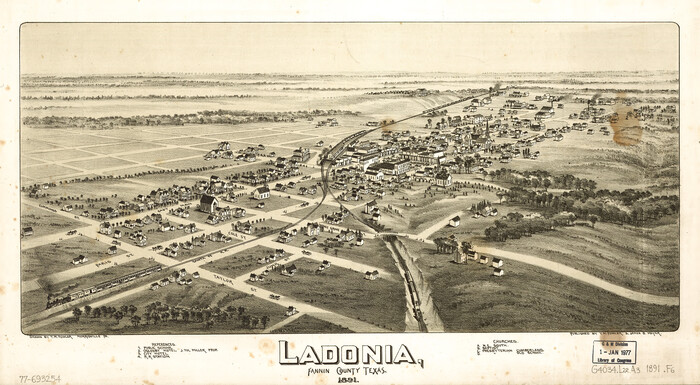
Ladonia, Fannin County, Texas
Print $20.00
Ladonia, Fannin County, Texas
1891
Size 12.3 x 22.3 inches
Map/Doc 93475
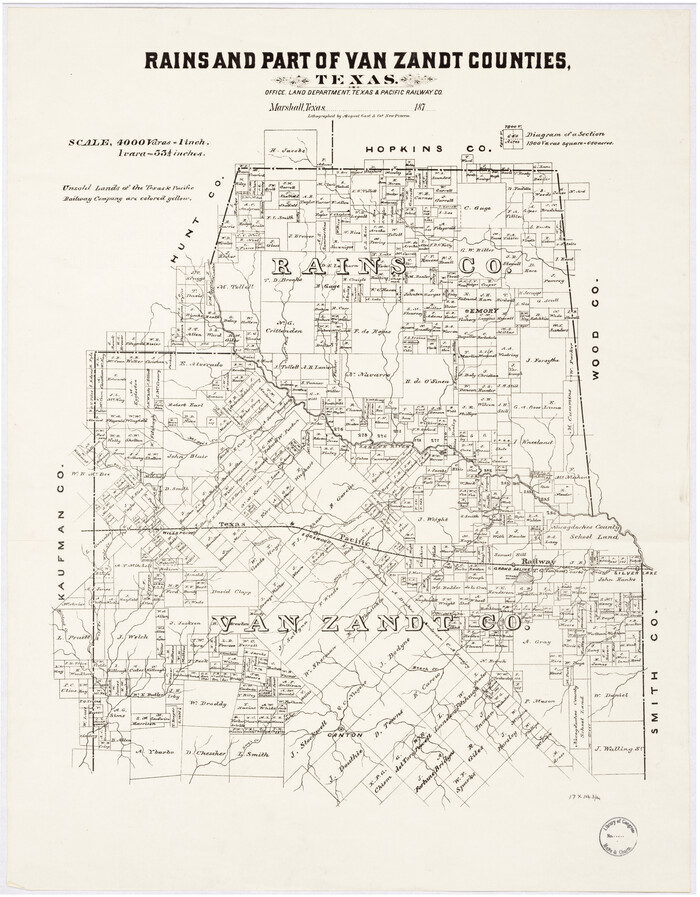
Rains and Part of Van Zandt Counties, Texas
Print $20.00
Rains and Part of Van Zandt Counties, Texas
1870
Size 22.2 x 17.3 inches
Map/Doc 88988
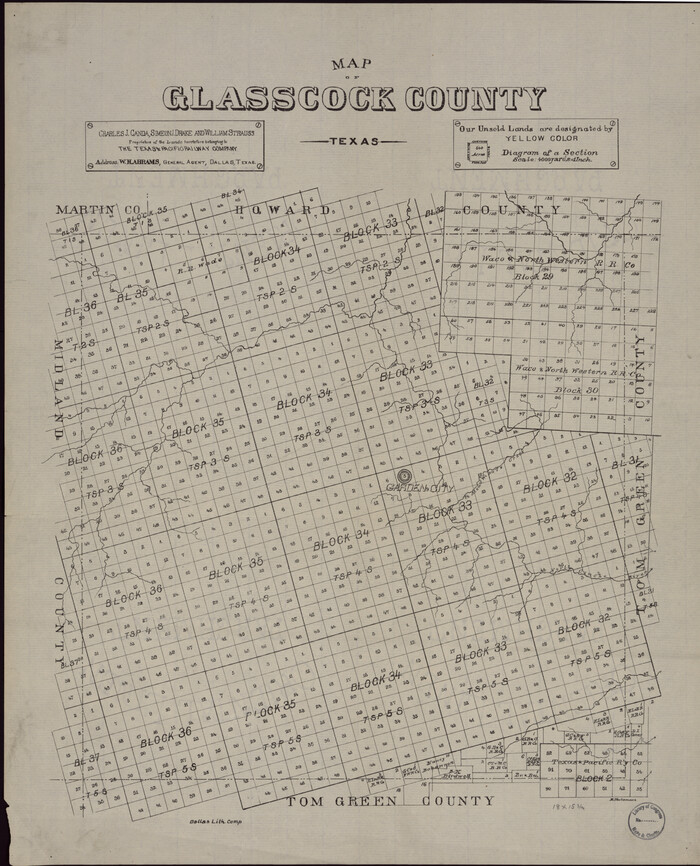
Map of Glasscock County, Texas
Print $20.00
Map of Glasscock County, Texas
Size 22.7 x 18.3 inches
Map/Doc 88943
[Map showing T&P Lands in El Paso County]
![88936, [Map showing T&P Lands in El Paso County], Library of Congress](https://historictexasmaps.com/wmedia_w700/maps/88936.tif.jpg)
Print $20.00
[Map showing T&P Lands in El Paso County]
Size 22.6 x 17.5 inches
Map/Doc 88936
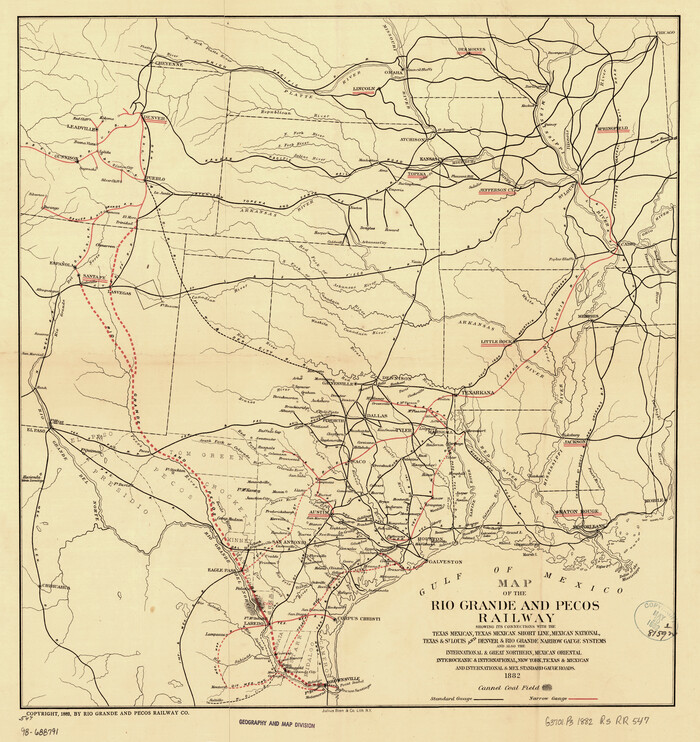
Map of the Rio Grande and Pecos Railway showing its connections with…
Print $20.00
Map of the Rio Grande and Pecos Railway showing its connections with…
1882
Size 42.1 x 40.2 inches
Map/Doc 93620
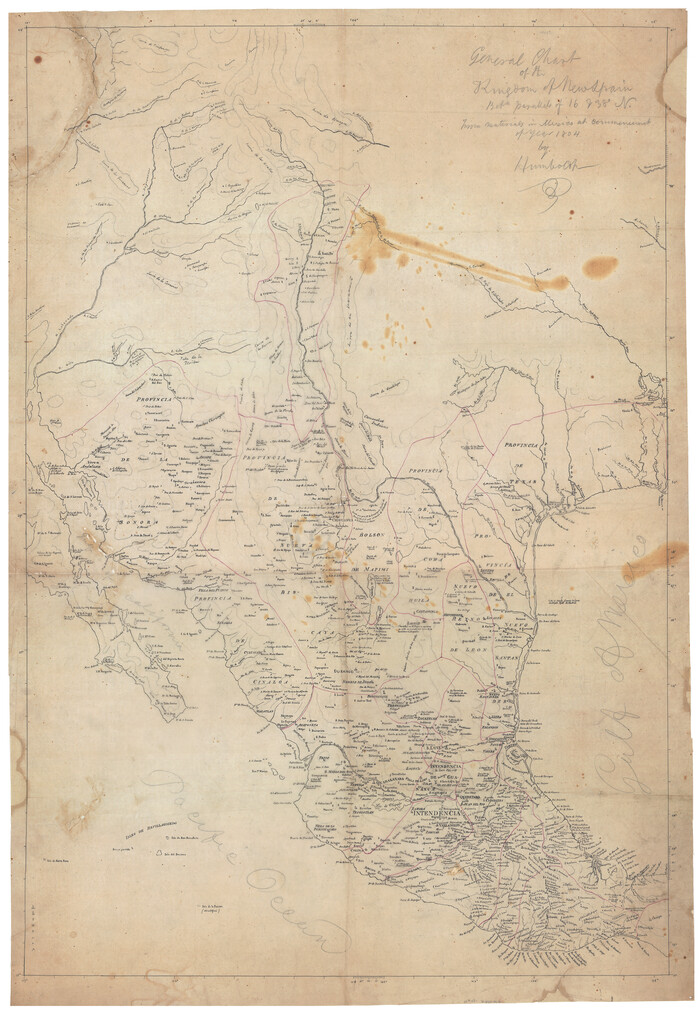
General Chart of the Kingdom of New Spain betn. parallels of 16 & 38° N. from materials in Mexico at commencement of year of 1804
Print $20.00
General Chart of the Kingdom of New Spain betn. parallels of 16 & 38° N. from materials in Mexico at commencement of year of 1804
1804
Size 38.4 x 26.5 inches
Map/Doc 95310
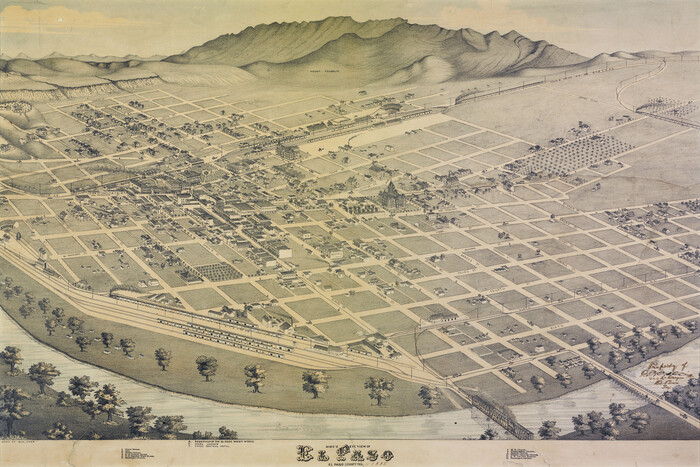
Bird's Eye View of El Paso
Print $20.00
Bird's Eye View of El Paso
1885
Size 20.0 x 30.0 inches
Map/Doc 93621
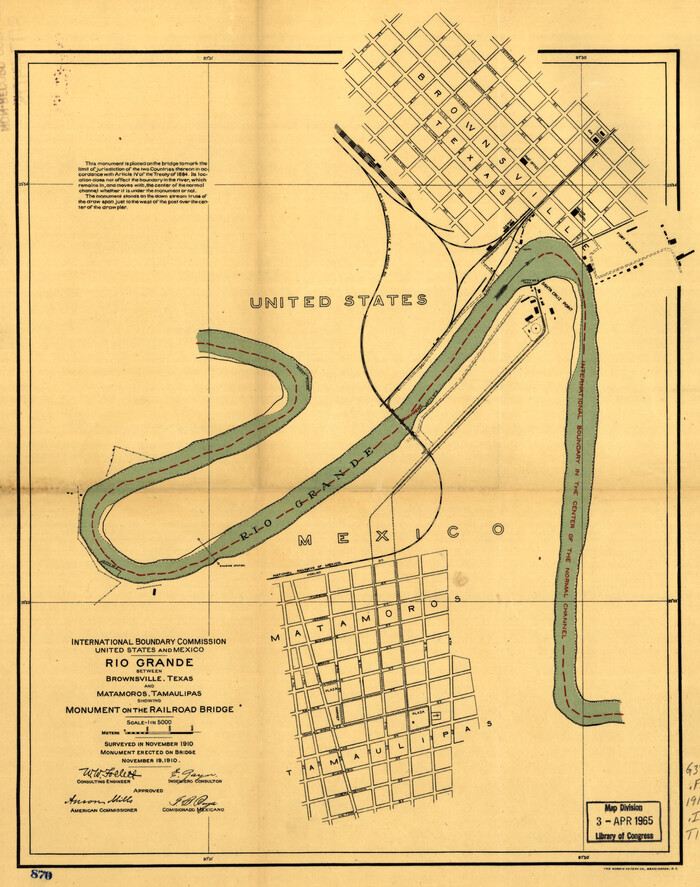
Boundaries between Brownsville, Texas and Matamoros, Tam. (Mexico)
Print $20.00
Boundaries between Brownsville, Texas and Matamoros, Tam. (Mexico)
1910
Size 15.0 x 11.8 inches
Map/Doc 93559
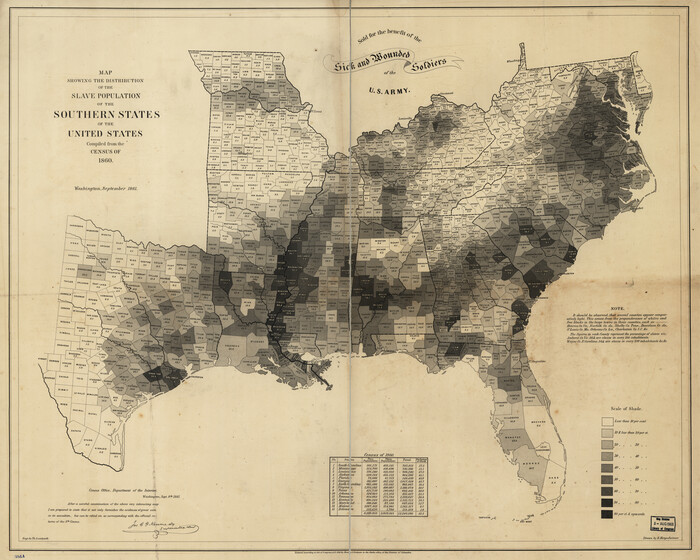
Map showing the distribution of the slave population of the southern states of the United States. Compiled from the census of 1860
Print $20.00
Map showing the distribution of the slave population of the southern states of the United States. Compiled from the census of 1860
1861
Size 27.8 x 34.8 inches
Map/Doc 95749
You may also like
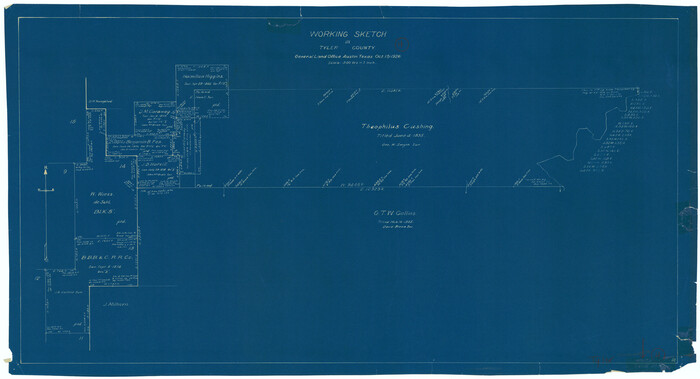
Tyler County Working Sketch 4
Print $20.00
- Digital $50.00
Tyler County Working Sketch 4
1926
Size 19.4 x 35.8 inches
Map/Doc 69474
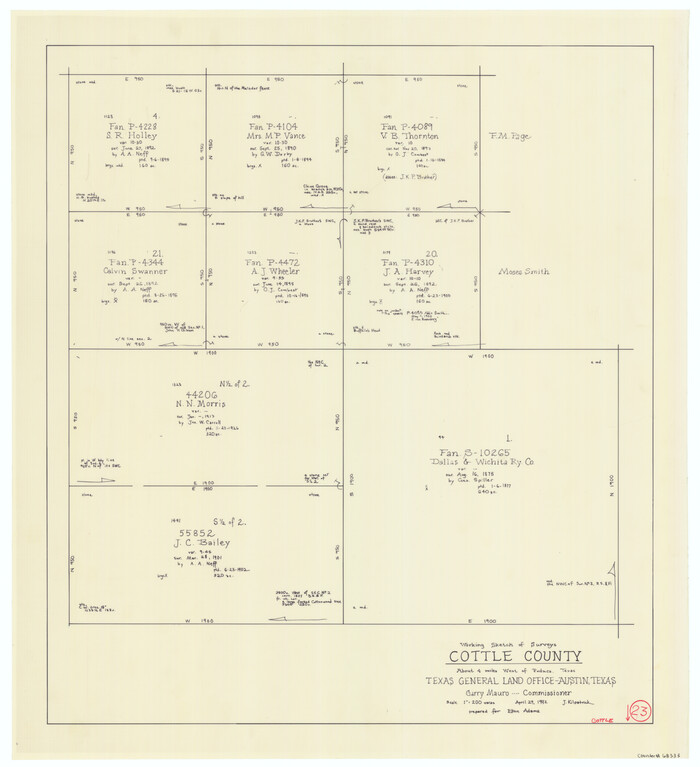
Cottle County Working Sketch 23
Print $20.00
- Digital $50.00
Cottle County Working Sketch 23
1992
Size 26.6 x 24.2 inches
Map/Doc 68333
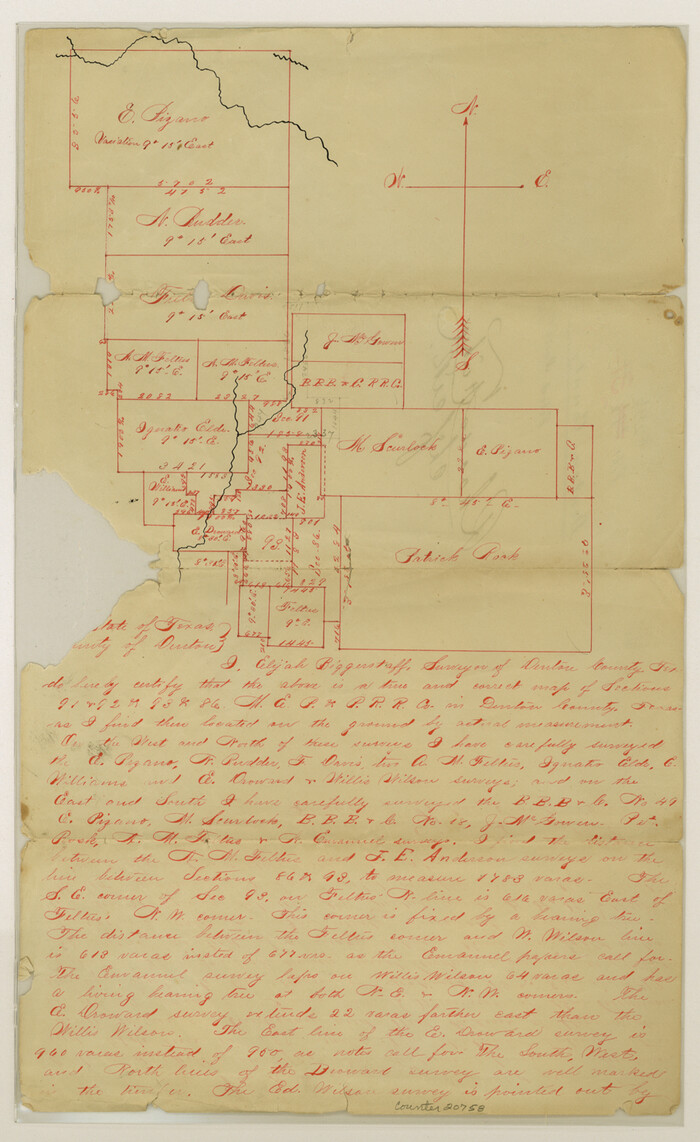
Denton County Sketch File 29 1/2
Print $4.00
- Digital $50.00
Denton County Sketch File 29 1/2
Size 14.8 x 9.1 inches
Map/Doc 20758
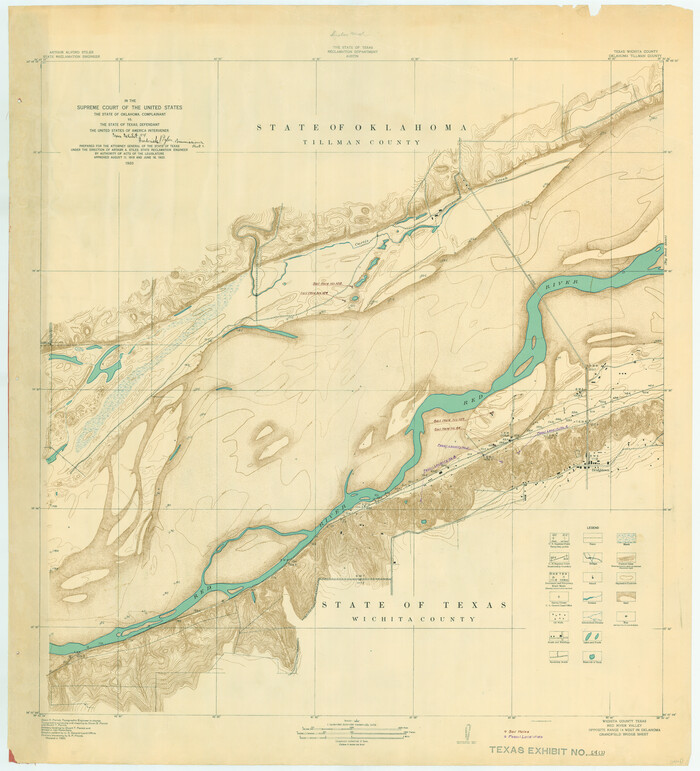
Grandfield Bridge Sheet
Print $20.00
Grandfield Bridge Sheet
1920
Size 39.4 x 35.8 inches
Map/Doc 79751
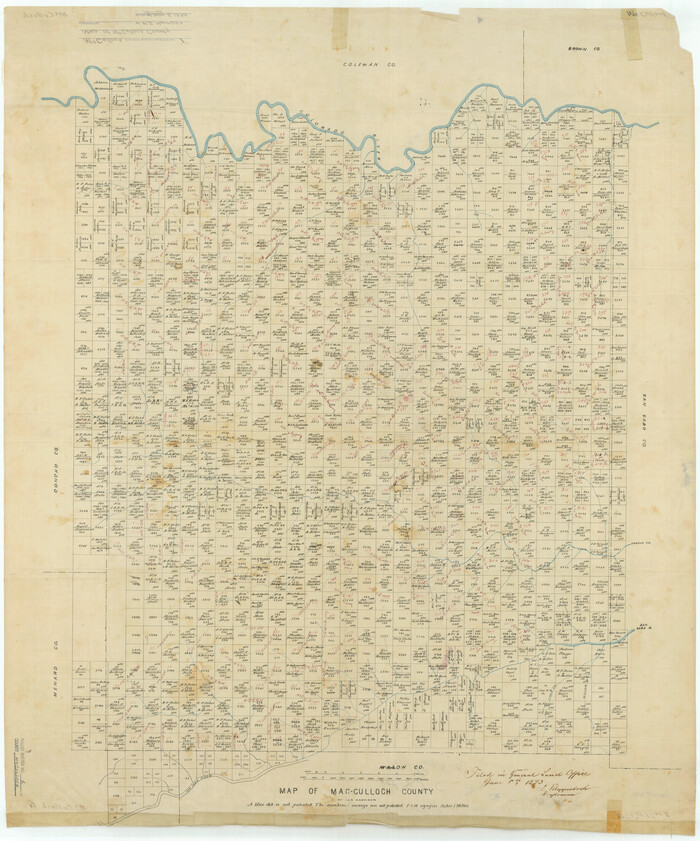
McCulloch County Rolled Sketch 1
Print $20.00
- Digital $50.00
McCulloch County Rolled Sketch 1
Size 44.4 x 36.9 inches
Map/Doc 9495
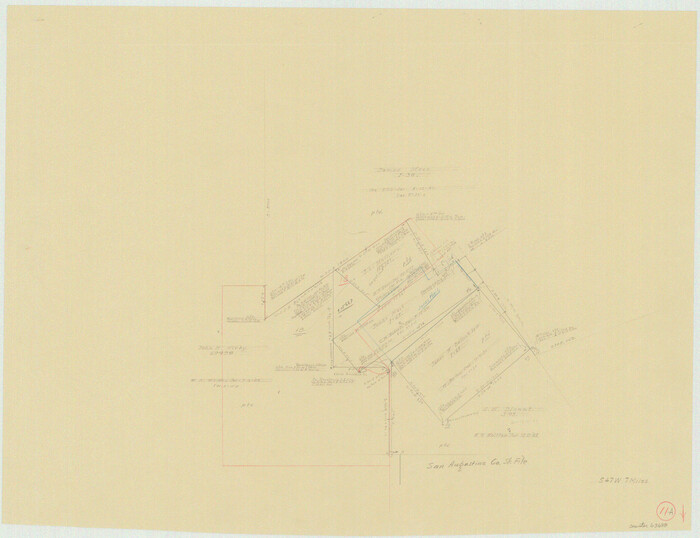
San Augustine County Working Sketch 11a
Print $20.00
- Digital $50.00
San Augustine County Working Sketch 11a
Size 18.8 x 24.4 inches
Map/Doc 63698
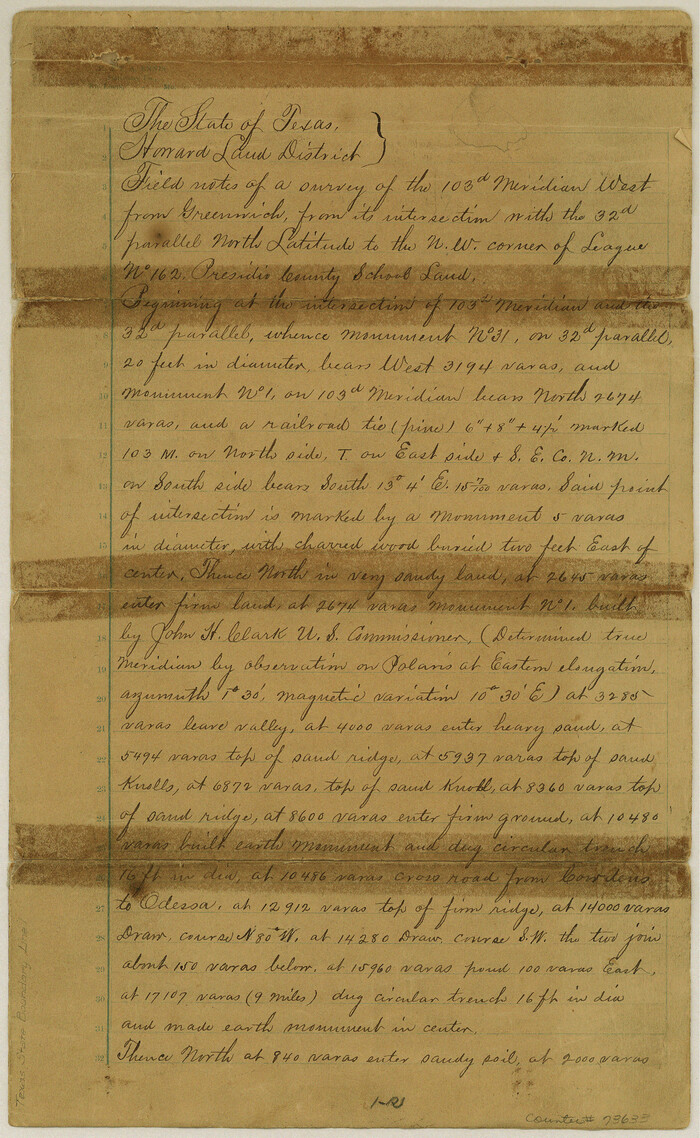
Texas State Boundary Line 1
Print $22.00
- Digital $50.00
Texas State Boundary Line 1
1892
Size 14.3 x 8.8 inches
Map/Doc 73633
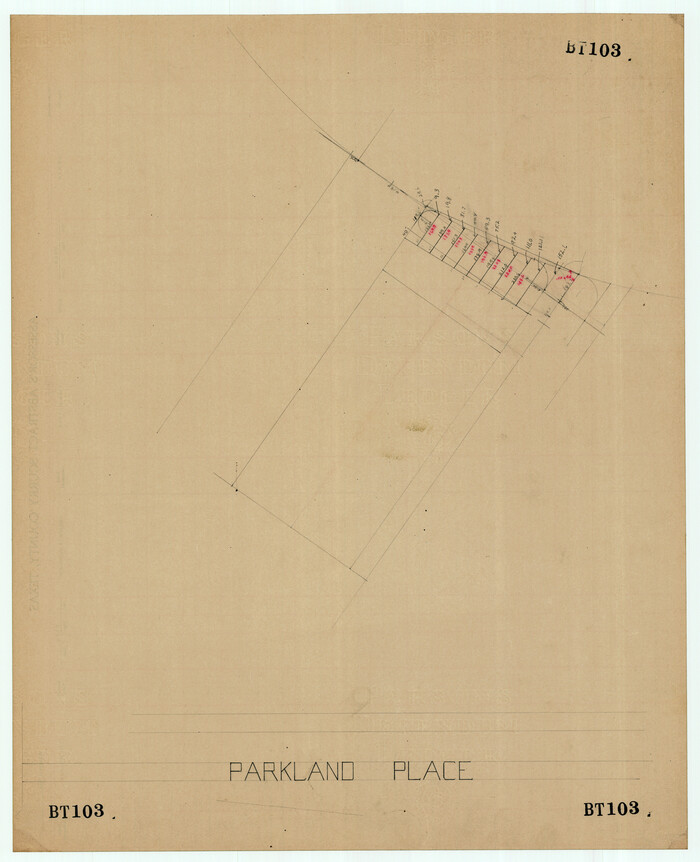
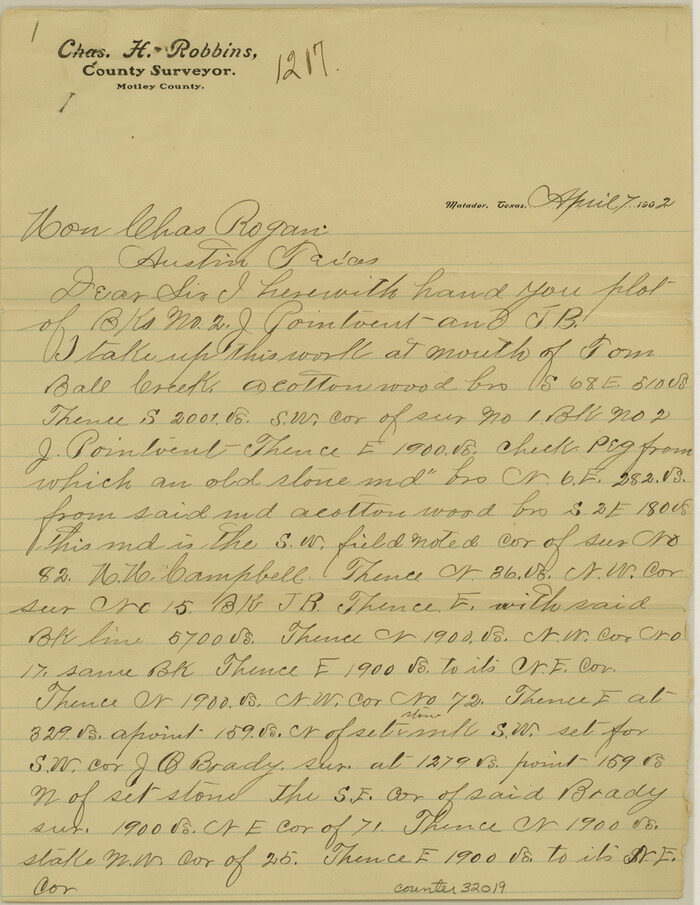
Motley County Sketch File 9 (N)
Print $10.00
- Digital $50.00
Motley County Sketch File 9 (N)
1902
Size 11.1 x 8.6 inches
Map/Doc 32019
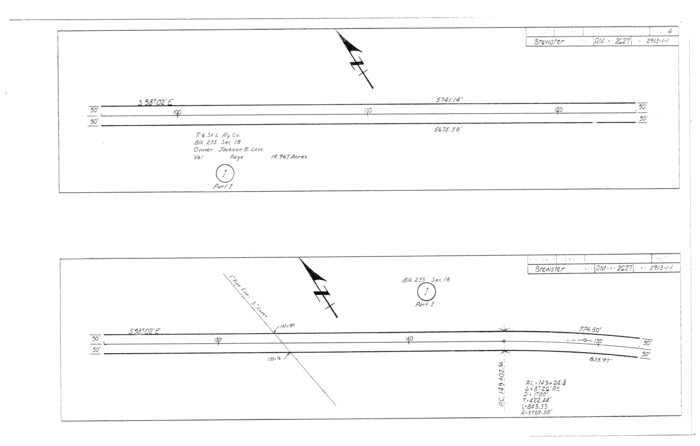
Brewster County Rolled Sketch 114
Print $20.00
- Digital $50.00
Brewster County Rolled Sketch 114
1964
Size 11.7 x 18.4 inches
Map/Doc 5267
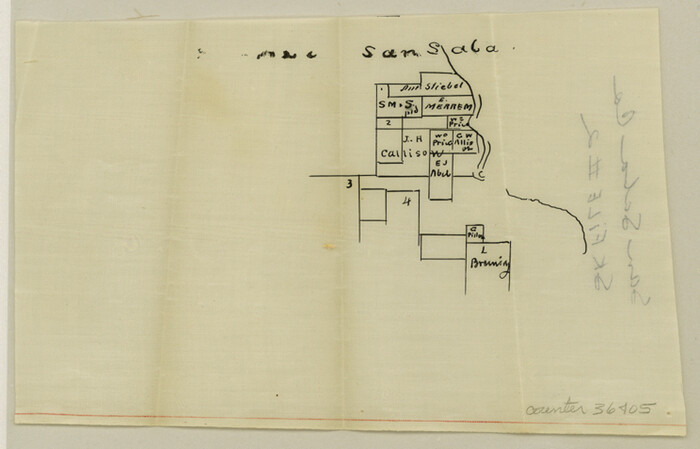
San Saba County Sketch File 2
Print $6.00
- Digital $50.00
San Saba County Sketch File 2
1854
Size 4.8 x 7.4 inches
Map/Doc 36405